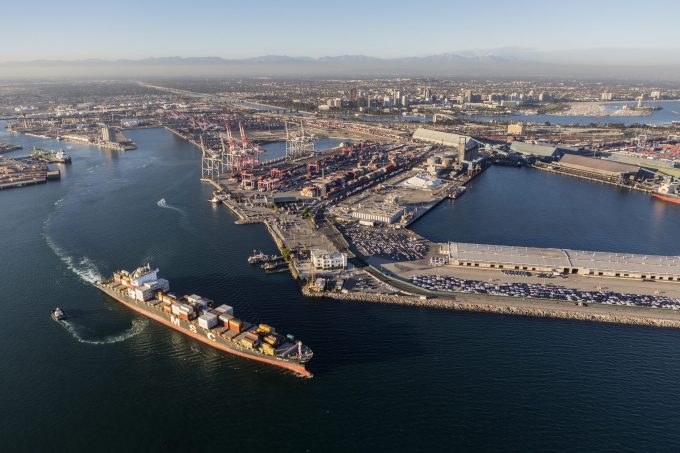
Port of Long Beach Photo 76106514 © trekandshoot Dreamstime.com
Photo: © trekandshoot

US container trade trends were in rude health in 2024, and the second Trump administration will inherit a relatively favourable backdrop, in terms of spending growth and inventory levels relative to sales, but it is likely that volume trends will become increasingly driven by reactions to the president’s actions on tariffs.

Our headline takeaway is that tariff anticipation, in combination with the prospect of a further east coast labour strike this month, is likely to extend a healthy period of US container import volumes further into the first half of 2025.

The proposed 25% tariffs on Mexican and Canadian imports are unlikely to have major implications for container trade – the Mexican tariffs could in theory just negate the economics of routing US volumes through Mexico, meaning some volumes shift from MSI’s Far East-Latin America trade back to the transpacific lane, which makes little difference from an overall liner demand-supply perspective.

The threatened 10% uplift to Chinese tariffs will have certainly incentivised some degree of front-loading, but is also less calamitous than other proposals vis-a-vis China that had been on the table. It remains unclear whether these tariffs will be implemented, or indeed whether Mr Trump will attempt to use untested procedures via executive action to introduce measures early in 2025.

As discussed further below, we are assuming that the threat/likelihood of tariffs will cause a proportion of trade to be brought forward into 2024/25 from 2026, but without making explicit assumptions about which countries and products will be targeted, over what timeframe or at what rate.

With the China tariffs more generally, it is worth remembering that the legacy tariffs from the first Trump administration have remained in place through the past five-to-six years and have done little to deter US spending on goods from China, or the Far East more generally; although, China’s share of overall teu imports has fallen by around 10% since 2018 and, clearly, the tariffs accelerated the relocation of some production away from China, a process that will continue in the years ahead.

It is not clear that adding 10% to existing tariffs will have a hugely significant impact on underlying end-user demand, unless a combination of policy measures proves highly inflationary and tanks US consumer spending (US consumer confidence, despite the resilience of spending, is already low to begin with).

Source: MSI

As the chart above shows, for the top 20 HS2 teu commodities the US imported from China in 2023, the uplift to average tariffs between the pre-Trump status quo and his first set of tariffs (blue line to solid yellow line) was proportionally greater for most important product categories than the proposed additional 10% uplift (solid yellow to dotted yellow).

Where the impact is likely to be greater is in the geographic sourcing of US imports over a longer time-frame, and in the distribution of import volumes over time. On the first point, while the 10% proposed uplift is not itself as dramatic as earlier proposals, it would leave a significant gap between tariffs on Chinese goods and those produced by other trading partners (assuming other major exporters are not targeted, which is certainly a possibility).

Furniture imports, long-established as the stalwart product on the transpacific headhaul trade, are subject to very limited tariffs if imported into the US under existing ‘most-favoured-nation’ terms (which are used as a proxy for the status quo for China before the 2018-19 tariffs), but would be subject to an average 35% tariff under Trump’s latest proposals.

On a teu volume-weighted basis, total US containerised imports from China are currently subject to an average tariff rate of 21.7%. This would rise to an average tariff rate of 31.7% under Trump’s latest proposals, and would compare with a 3.2% average tariff rate for imports brought in under ‘most-favoured-nation’ terms.

There will clearly be growing incentives to shift production away from China, but this is likely to be a drawn-out process, given the difficulties of replicating China’s current manufacturing capacity and know-how, and port and logistics infrastructure.

Where things are likely to change more rapidly is in the distribution of imports over time, and in the prospect for another cycle of import front-loading into 2025.

Here, Trump’s first term in office provided some lessons. While importers were caught relatively offguard by a sudden flurry of tariff announcements in Q2-Q3 2018, there was enough time to make a concerted effort to bring goods in before a particular set of tariffs came into force on 1 January 2019.

Source: MSI

This led to the major swing in volumes seen in the chart above, which turbocharged the normal seasonal fall in volumes around lunar new year (although, in typical fashion, the 1 January deadline was, in practice, delayed).

We expect something similar will play out this time. The timing is liable to shift as concrete policies are announced, but for the moment we have increased our forecast for transpacific eastbound trade in 2025, at the expense of volumes in 2026.

It would otherwise be hard to justify much positive growth on this trade next year, given the scale of imports brought in over the course of 2024, although the underlying fundamentals do remain firm in terms of consumer spending and inventory holdings.

Following expected full-year transpacific headhaul growth of 14.5% yoy in 2024, we now forecast volume growth of 5.9% yoy in 2025, and a 5% contraction in 2026.

Needless to say, these numbers are subject to substantial uncertainty.

This is a guest post by Daniel Richards, associate director at Maritime Strategies International

Comment on this article


You must be logged in to post a comment.