Maersk profit update sparks claims carriers are exploiting disruption
Shippers have accused ocean carriers of exploiting the market disruption through “opaque surcharges” and reduced ...

VW: THE LAST CUT IS THE DEEPESTJBHT: GEARING UP VW: BUYING TIMER: BIG VOTE OF CONFIDENCEAAPL: BEARISH HEDGEYE AAPL: THE BEAR CASEFDX: LIFE SCIENCES ORG UNVEILEDWTC: UPS AND DOWNSWTC: ASX ANNOUNCEMENT REGARDING DSV PARTNERSHIP VW: D-DAYPLD: KEEP PUSHINGDHL: NEW AIR SERVICEDHL: GUIDANCE UPGRADE REACTION
VW: THE LAST CUT IS THE DEEPESTJBHT: GEARING UP VW: BUYING TIMER: BIG VOTE OF CONFIDENCEAAPL: BEARISH HEDGEYE AAPL: THE BEAR CASEFDX: LIFE SCIENCES ORG UNVEILEDWTC: UPS AND DOWNSWTC: ASX ANNOUNCEMENT REGARDING DSV PARTNERSHIP VW: D-DAYPLD: KEEP PUSHINGDHL: NEW AIR SERVICEDHL: GUIDANCE UPGRADE REACTION

JB Hunt is widely recognised in North America as one of the best-managed freight companies in the region – proved, once again, in the preliminary fourth-quarter and annual results the US trucking and brokerage firm released last week.
The details can be found at the link above, but I’ll flag some of the key trends for its operating business lines and a few other financials metrics. I’ll also look at its capital allocation strategy in order to determine whether JB Hunt could do anything to deliver higher returns to its shareholders.
Fourth-quarter highlights
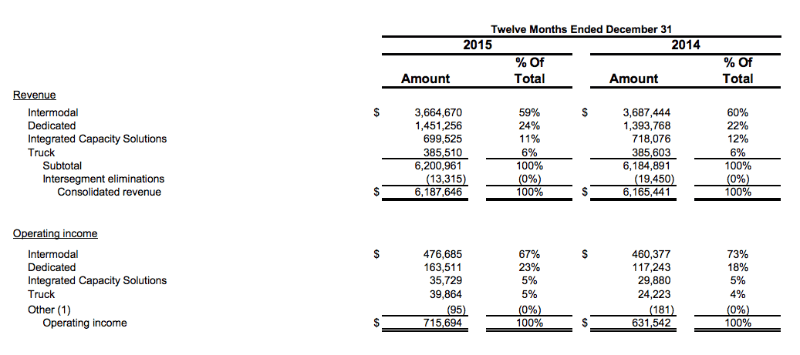
Total fourth-quarter operating revenues came in at $1.62bn, and were essentially flat compared with the year before. The group said that a load growth of 6% in Intermodal (JBI) was the “primary reason” for a 1% increase in sales.
Meanwhile, the top line of its dedicated contract services unit (DCS) rose 2%, “primarily from the addition of new customer accounts and rate increases implemented in the current and earlier periods”.
The truck (JBT) segment saw a rise in revenues of 3%, “primarily from customer rate increases and an increase in fleet size compared to a year ago”. And finally, the integrated capacity solutions (ICS) division contracted by 4%, mostly from “less spot market activity” and “lower revenue per load”.
“Current quarter total operating revenue, excluding fuel surcharges, increased 9% versus the comparable quarter in 2014,” the company added.
On 31 December 2015 it had gross debt of $1bn, which compares with $934m at the end of 2014 and $993m in the third quarter of last year. The group is carefully managing capital expenditures, which totalled $556m last year versus $660m in 2014.
At the end of last year it had cash and cash equivalents of just $5.6m – which makes a lot of sense given the lowly yield on cash these days.
Operating income, meanwhile, rose, as the table below shows.
The question now is how JB Hunt is going to exploit its balance sheet to deliver more value to existing shareholders, while also attracting new investors. Its two-year share price performance has seen a decline of 11%, although the plunge in equity valuations of most freight companies in the second half 2015 greatly contributed to that drop.
Capital allocation
While some market observers have speculated that JB Hunt could tie the knot either with BNSF or Norfolk Southern – the latter formally rejected a revised offer from Canadian Pacific in late December, a subject I have extensively covered – I believe it more likely that JB Hunt will look for bolt-on deals while trying to focus on efficiency and organic growth, which remains its chief mission.
Earnings per share (EPS) rose 8.6% on a fully diluted basis in the fourth quarter. For the 12 months ended 31 December 2015, EPS climbed 15.8% to $3.66 – what does this tell us?
Well, JB Hunt is so efficient that even at a very critical economic juncture it managed to knock off 160 basis points from rents and purchased transportation – its largest operating cost – which amounted to 50% of revenue in 2014, and 48.6% of revenue in 2015.
Lower fuel and fuel taxes allowed it to increase the amount it paid in salaries and benefits to almost $1.4bn in 2015, from $1.29bn in 2014. That rise amounts to $104m, and is even more remarkable because its represents 24.3% of its net earnings ($427m).
Furthermore, EPS received minimal contribution from a lower share count, which also testifies to financial discipline in stock repurchases.
In the fourth quarter, it purchased 672,500 shares for about $50m, but at the end of 2015, it still had “approximately $451m remaining under our share repurchase authorisation”. Actual shares outstanding at 31 December were approximately 114 million, it said.
Its buyback programme was only announced on 22 October – there wasn’t much time to spend half a billion dollars on buybacks. But it is also safe to assume that capital will be allocated to shrink the share count only if strictly necessary, and depending on market conditions, which may prevent JB Hunt from spending it on its own stock as it originally planned.
One obvious alternative would be to offer a higher yield to investors – a potentially sensible option if volatility persists.
The VIX (volatility) index is now at 24, but should oil prices continue their slide to the low $20s a barrel, it could well end up sitting above the safety threshold of 30. If that is the case, investors will likely want to hold minimal exposure to income stocks that carry a yield lower than inflation in 2016 and 2017.
Its 2016 yield is forecast at 1.26%. Based on its current stock price, and assuming a 10% growth in EPS in 2016, its forward payout ratio would come in at about 20% at the end of 2016, which is broadly in line with market consensus estimates.
In a market where portfolio rotation might become mandatory in order to preserve returns, investors have to make a choice between growth and yield, and the latter seems to have become the preferred option these days. So, JB Hunt could even take the brave decision to cancel its buyback programme – given its track record, however, I guess its management team has already thought through all the possible alternatives.

For uninterrupted access, sign in or sign up to The Daily News, Premium or The Loadstar Enterprise Plan.
Comment on this article