Inchape launches US forwarding service
Leading global port agency provider Inchcape Shipping Services is moving into the US freight forwarding ...

MAERSK: ANOTHER UPGRADEFWRD: HEALTHY CORRECTION R: RYDER CEO SAYS R: AMAZON ANNOUNCEMENTS RPLD: EV INFRASTRUCTURE PUSHDHL: RAMPING UP 'NEW ENERGY LOGISTICS' GXO: NEW WINAMZN: LTL SERVICE UPDATEGM: ENERGY PROVIDER MODELEXPD: LAYOFFS CONFIRMED DHL: DOWNSIDE RISKDHL: OVERVIEWDHL: DATE CENTRE PUSH IN APAC
MAERSK: ANOTHER UPGRADEFWRD: HEALTHY CORRECTION R: RYDER CEO SAYS R: AMAZON ANNOUNCEMENTS RPLD: EV INFRASTRUCTURE PUSHDHL: RAMPING UP 'NEW ENERGY LOGISTICS' GXO: NEW WINAMZN: LTL SERVICE UPDATEGM: ENERGY PROVIDER MODELEXPD: LAYOFFS CONFIRMED DHL: DOWNSIDE RISKDHL: OVERVIEWDHL: DATE CENTRE PUSH IN APAC

One often hears commentary that, firstly, there is no substitute for China when it comes to imported manufactured goods; and secondly, it will take years – potentially decades – to build up supply chains that do not include China.
These are very misleading myths.
In the past 10 years, according to US Census Bureau, trade [bills of lading] data, China’s share of the tonnage of US containerised imported goods peaked in 2018 at 37%, and have since declined to below 30%, even though US containerised volumes have continued to grow.
(More recent data for 2025 is not available, due to the US federal government shutdown that has left many data sites such as the Census Bureau unavailable)
Many pundits talk about the difficulties concerning rebuilding supply chains using non-China based suppliers. However, trade data indicates that this unlikely to be true for the US.
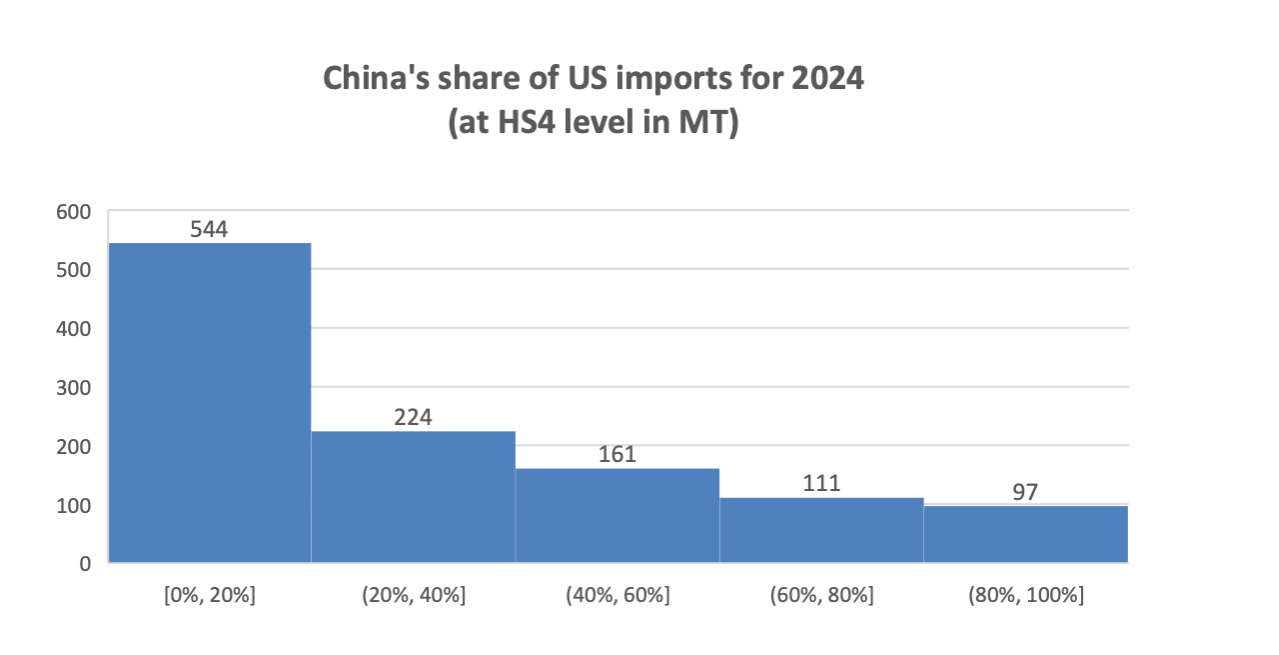
Census Bureau data shows that the US imports 1,137 commodity types classified at the 4-digit Harmonised System code level. The chart below shows that for 544 of these commodities (48% of all commodities), China’s share of US imports is less than 20%. For the next 20% of total commodities (224), China’s share is less than 40%. For the next share of 20% of the commodities (161), China’s share is less than 60%. Thus, for 929 of the 1,137 commodities (82% of the total), China’s share of US containerised commodities is less than 60%.
What does this mean?
The clear message is that there are plenty of alternative countries that US importers can access to reduce their dependence on Chinese suppliers. This is evident in US trade data and in logistics industry news. The well-known alternatives that are evident in the data include Vietnam (gaining 4.4% of US containerised imports between 2018 to 2025 July 2025), India (1.6% gain over the same period), and Mexico, where the gain can only be measured in value, since the US does not publish useful truck and rail data to make comparisons with maritime volume data.
What’s next?
Our analysis of US trade value by country and by port is shown in the chart below.
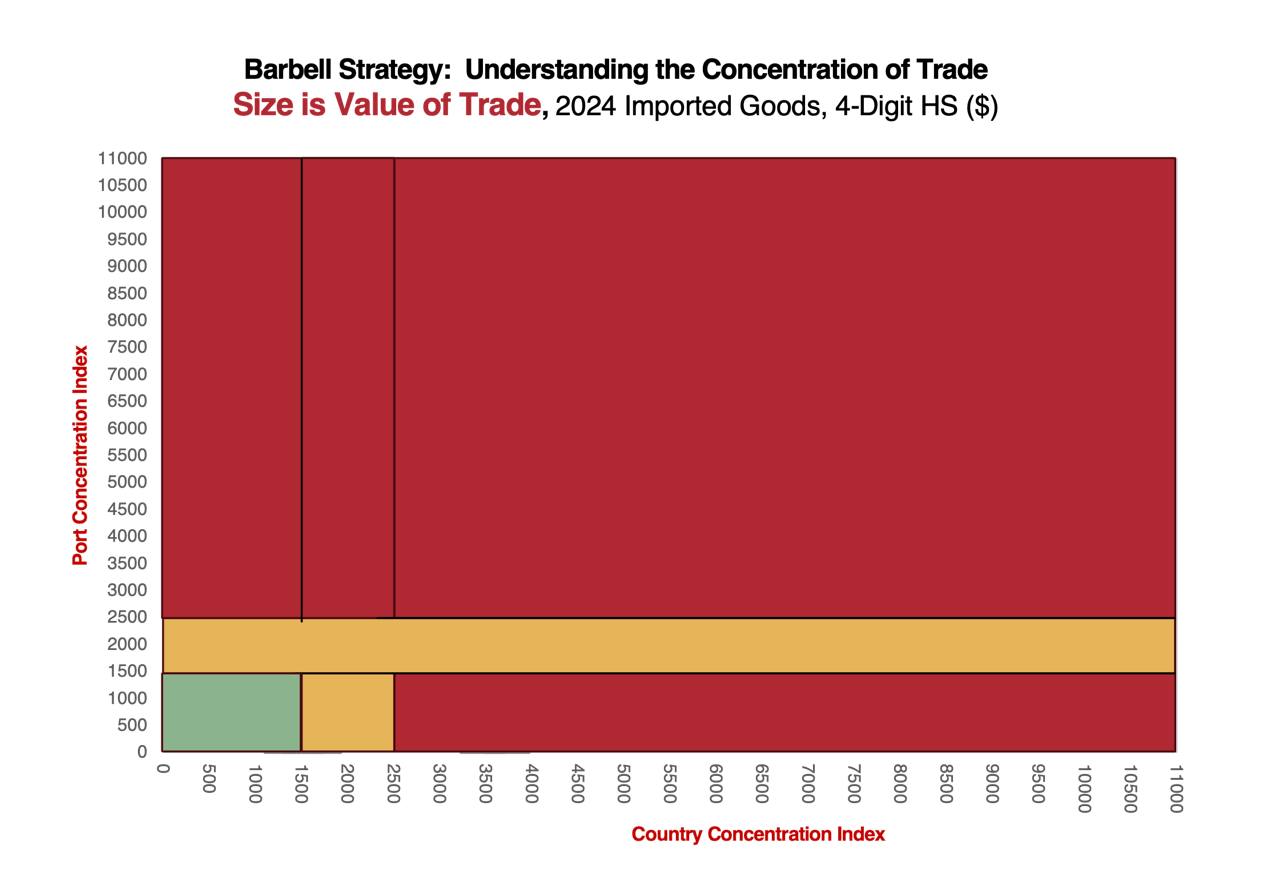
On the vertical axis is a measure of the concentration of containerised imports by port of entry using the Hirschman-Herfindahl index. The horizontal index shows the concentration of US containerised commodities. The lower left of the chart is very populated, indicating that US supply chains for those commodities are very resilient, in that they source commodities from a wide base of countries and bring them into the country through a wide range of ports. The commodity supply chains on the upper right-hand side of the chart are the most vulnerable ones since they are very concentrated from few suppliers and enter the US through few ports.
Importers of commodities grouped in the lower lefthand side of the chart are likely to see some shifting of sourcing between countries and Chinese suppliers are likely to see continuing loss of US imported goods share. Those on the upper right-hand side are likely to be difficult to restructure.
It is important to appreciate that, while we do show the tabulation of Chinese-dominated commodities, and that it implies they have less of a stranglehold on US imports, that does not factor-in the relative importance of those commodities. If half of the commodities where the US hardly does any trade, and they have little to do with China, then that statistic is prone to overstating the situation.
We believe that US importers are going to focus on a “barbell strategy”, where they focus on diversifying supply sources and entry channels into the US by using more seaports and airports. It is important to realise that we are strategically interpreting the barbell graph in relation to China. However, that is not how it is being calculated – it’s a summary of the complete US import market – just as many commodities that find themselves too concentrated on only a few exporters could be coming from places like Canada, or Germany. It’s not broken out further to just fixate only on Chinese goods.
We believe transport and logistics services providers should focus on facilitating these supply chain restricting changes.
(This column was originally published by Loadstar Premium on 4 November)
(Widely viewed as one of the foremost experts on ports, rail, and infrastructure in the US, Walter Kemmsies currently advises several major US port authorities and is routinely asked to work on complex issues with various investment banks. private equity firms, and public regulatory agencies. Dr Kemmsies was chief rconomist for Moffat & Nichol, and other previous roles include head of European strategy at JP Morgan in London, and head of global industry strategy at UBS in Zurich)
For uninterrupted access, sign in or sign up to The Daily News, Premium or The Loadstar Enterprise Plan.

Comment on this article