Why Europe has the dream, but struggles to build freight-tech giants
Europe may have produced some of freight tech’s most ambitious start-ups, but building them into ...

WTC: ANOTHER DIFFICULT WEEK CHRW: NEW PRODUCT LAUNCHDSV: LEADING THE DROP RXO: CRATERINGDSV: WHAT TO LIKEDSV: BULLISH BAMZN: 'AI EDGE'HD: HERE IS HOW IT LOOKSAMZN: REG RISKMAERSK: MOST HARMED
WTC: ANOTHER DIFFICULT WEEK CHRW: NEW PRODUCT LAUNCHDSV: LEADING THE DROP RXO: CRATERINGDSV: WHAT TO LIKEDSV: BULLISH BAMZN: 'AI EDGE'HD: HERE IS HOW IT LOOKSAMZN: REG RISKMAERSK: MOST HARMED
PRESS RELEASE
Beacon, the supply chain visibility platform, is now offering free container dwell reports through its new website.
The new tool enables customers to easily compare their own container dwell times to others at the same ports and find out how they are performing compared to the rest of the market. Beacon’s data covers 64 of the world’s leading ports in the UK, Europe, North America, South America, Asia and Australia.
This latest feature further enhances Beacon’s existing suite of supply chain visibility tools, which include a customisable user dashboard, advanced reporting and analytics functionality, and planning tools.
Beacon has analysed the data for the six-month period from January to June 2023 in order to assess which ports had the lowest and highest average monthly container dwell times.
Key observations include:
Ports with the lowest average monthly container dwell time (across January-June period):
| Ranking | Port | Country | Average container dwell time in days per month |
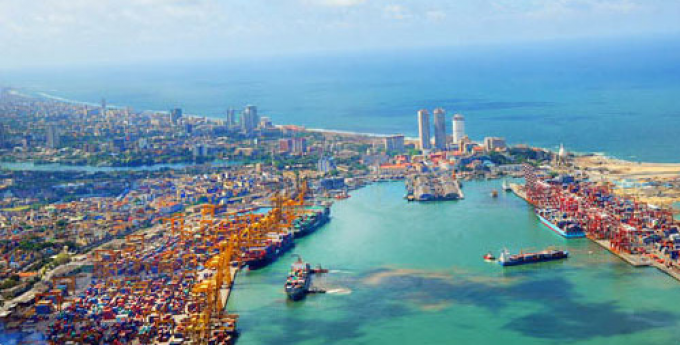
| 1 | Colombo | Sri Lanka | 1.8 |
| 2 | Melbourne | Australia | 1.9 |
| 3 | Sydney | Australia | 2.1 |
| 4 | Charleston | USA | 2.5 |
| 5 | Singapore | Singapore | 2.9 |
| 6 | New York/New Jersey | USA | 3.1 |
| 6 | Norfolk | USA | 3.1 |
| 8 | Callao | Peru | 3.2 |
| 9 | Jeddah | Saudi Arabia | 3.5 |
| 9 | Savannah | USA | 3.5 |
Ports with the highest average monthly container dwell time (across January-June period):
| Ranking | Port | Country | Average container dwell time in days per month |
| 64 | Kingston | Jamaica | 9.1 |
| 63 | Chittagong | Bangladesh | 8.9 |
| 62 | Piraeus | Greece | 8.0 |
| 60 | Hai Phong | Vietnam | 7.8 |
| 60 | Ho Chi Minh City | Vietnam | 7.8 |
| 59 | Manila | The Philippines | 7.7 |
| 58 | Le Havre | France | 7.4 |
| 56 | Qingdao | China | 7.0 |
| 56 | Liverpool | UK | 7.0 |
| 55 | Nagoya | Japan | 6.9 |
Fraser Robinson, CEO of Beacon, commented: “At Beacon, it’s our goal to provide true visibility across the entire supply chain so that we can create positive change for shippers. Providing free container dwell reports is another way in which we are shining a light on data dark spots, equipping businesses with the information they need to make informed decisions about their shipping processes.”
For uninterrupted access, sign in or sign up to The Daily News, Premium or The Loadstar Enterprise Plan.

Comment on this article